Profiling Android UI Performance
We try our best to deliver buttery-smooth UI performance by default, but sometimes that just isn't possible. Remember, Android supports 10k+ different phones and is generalized to support software rendering: the framework architecture and need to generalize across many hardware targets unfortunately means you get less for free relative to iOS. But sometimes, there are things you can improve (and many times it's not native code's fault at all!).
The first step for debugging this jank is to answer the fundamental question of where your time is being spent during each 16ms frame. For that, we'll be using a standard Android profiling tool called systrace. But first...
Make sure that JS dev mode is OFF!
You should see
__DEV__ === false, development-level warning are OFF, performance optimizations are ONin your application logs (which you can view usingadb logcat)
Profiling with Systrace #
Systrace is a standard Android marker-based profiling tool (and is installed when you install the Android platform-tools package). Profiled code blocks are surrounded by markers start/end markers which are then visualized in a colorful chart format. Both the Android SDK and React Native framework provide standard markers that you can visualize.
Collecting a trace #
NOTE:
Systrace support was added in react-native
v0.15. You will need to build with that version to collect a trace.
First, connect a device that exhibits the stuttering you want to investigate to your computer via USB and get it to the point right before the navigation/animation you want to profile. Run systrace as follows
A quick breakdown of this command:
timeis the length of time the trace will be collected in secondssched,gfx, andvieware the android SDK tags (collections of markers) we care about:schedgives you information about what's running on each core of your phone,gfxgives you graphics info such as frame boundaries, andviewgives you information about measure, layout, and draw passes-a <your_package_name>enables app-specific markers, specifically the ones built into the React Native framework.your_package_namecan be found in theAndroidManifest.xmlof your app and looks likecom.example.app
Once the trace starts collecting, perform the animation or interaction you care about. At the end of the trace, systrace will give you a link to the trace which you can open in your browser.
Reading the trace #
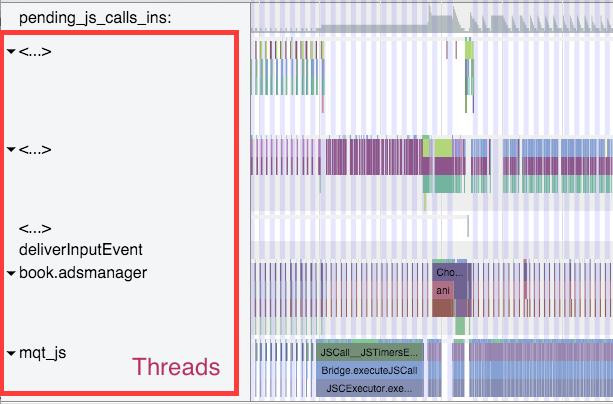
After opening the trace in your browser (preferrably Chrome), you should see something like this:
HINT: Use the WASD keys to strafe and zoom
Enable VSync highlighting #
The first thing you should do is highlight the 16ms frame boundaries if you haven't already done that. Check this checkbox at the top right of the screen:
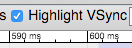
You should see zebra stripes as in the screenshot above. If you don't, try profiling on a different device: Samsung has been known to have issues displaying vsyncs while the Nexus series is generally pretty reliable.
Find your process #
Scroll until you see (part of) the name of your package. In this case, I was profiling com.facebook.adsmanager, which shows up as book.adsmanager because of silly thread name limits in the kernel.
On the left side, you'll see a set of threads which correspond to the timeline rows on the right. There are three/four threads we care about for our purposes: the UI thread (which has your package name or the name UI Thread), mqt_js and mqt_native_modules. If you're running on Android 5+, we also care about the Render Thread.
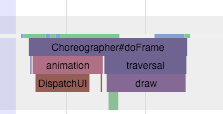
UI Thread #
This is where standard android measure/layout/draw happens. The thread name on the right will be your package name (in my case book.adsmanager) or UI Thread. The events that you see on this thread should look something like this and have to do with Choreographer, traversals, and DispatchUI:
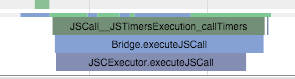
JS Thread #
This is where JS is executed. The thread name will be either mqt_js or <...> depending on how cooperative the kernel on your device is being. To identify it if it doesn't have a name, look for things like JSCall, Bridge.executeJSCall, etc:
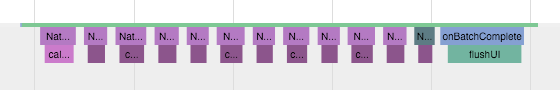
Native Modules Thread #
This is where native module calls (e.g. the UIManager) are executed. The thread name will be either mqt_native_modules or <...>. To identify it in the latter case, look for things like NativeCall, callJavaModuleMethod, and onBatchComplete:
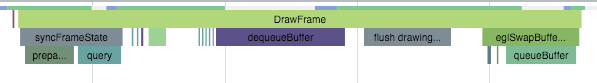
Bonus: Render Thread #
If you're using Android L (5.0) and up, you will also have a render thread in your application. This thread generates the actual OpenGL commands used to draw your UI. The thread name will be either RenderThread or <...>. To identify it in the latter case, look for things like DrawFrame and queueBuffer:
Identifying a culprit #
A smooth animation should look something like the following:
Each change in color is a frame -- remember that in order to display a frame, all our UI work needs to be done by the end of that 16ms period. Notice that no thread is working close to the frame boundary. An application rendering like this is rendering at 60FPS.
If you noticed chop, however, you might see something like this:
Notice that the JS thread is executing basically all the time, and across frame boundaries! This app is not rendering at 60FPS. In this case, the problem lies in JS.
You might also see something like this:
In this case, the UI and render threads are the ones that have work crossing frame boundaries. The UI that we're trying to render on each frame is requiring too much work to be done. In this case, the problem lies in the native views being rendered.
At this point, you'll have some very helpful information to inform your next steps.
JS Issues #
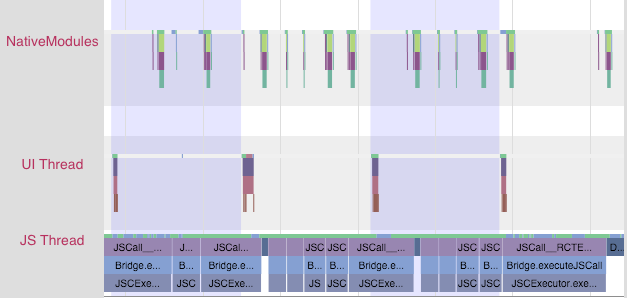
If you identified a JS problem, look for clues in the specific JS that you're executing. In the scenario above, we see RCTEventEmitter being called multiple times per frame. Here's a zoom-in of the JS thread from the trace above:
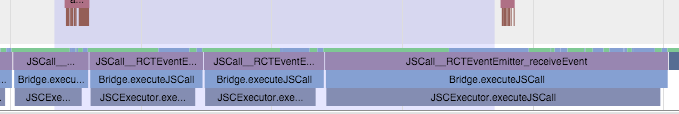
This doesn't seem right. Why is it being called so often? Are they actually different events? The answers to these questions will probably depend on your product code. And many times, you'll want to look into shouldComponentUpdate.
TODO: Add more tools for profiling JS
Native UI Issues #
If you identified a native UI problem, there are usually two scenarios:
- the UI you're trying to draw each frame involves to much work on the GPU, or
- You're constructing new UI during the animation/interaction (e.g. loading in new content during a scroll).
Too much GPU work #
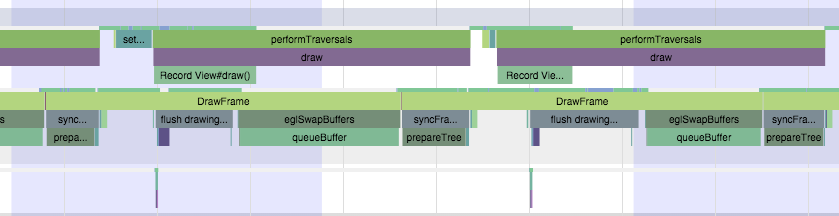
In the first scenario, you'll see a trace that has the UI thread and/or Render Thread looking like this:
Notice the long amount of time spent in DrawFrame that crosses frame boundaries. This is time spent waiting for the GPU to drain its command buffer from the previous frame.
To mitigate this, you should:
- investigate using
renderToHardwareTextureAndroidfor complex, static content that is being animated/transformed (e.g. theNavigatorslide/alpha animations) - make sure that you are not using
needsOffscreenAlphaCompositing, which is disabled by default, as it greatly increases the per-frame load on the GPU in most cases.
If these don't help and you want to dig deeper into what the GPU is actually doing, you can check out Tracer for OpenGL ES.
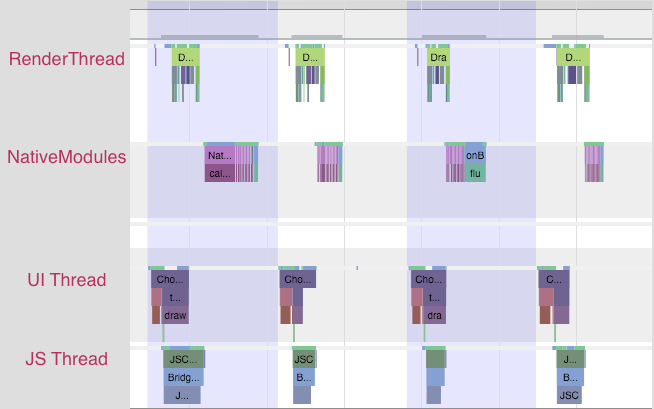
Creating new views on the UI thread #
In the second scenario, you'll see something more like this:
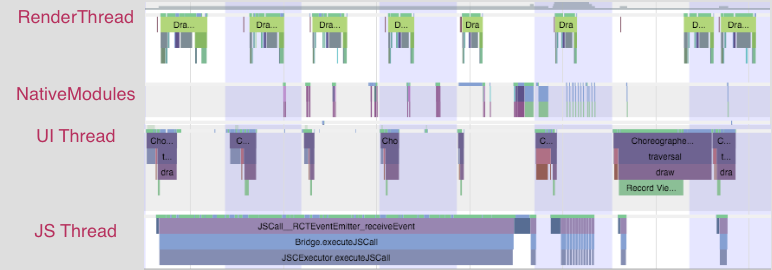
Notice that first the JS thread thinks for a bit, then you see some work done on the native modules thread, followed by an expensive traversal on the UI thread.
There isn't an easy way to mitigate this unless you're able to postpone creating new UI until after the interaction, or you are able to simplify the UI you're creating. The react native team is working on a infrastructure level solution for this that will allow new UI to be created and configured off the main thread, allowing the interaction to continue smoothly.
Still stuck? #
If you are confused or stuck, please post ask on Stack Overflow with the react-native tag. If you are unable to get a response there, or find an issue with a core component, please File a Github issue.